
DataInsights WebApp extend a new chart |
DataInsights WebApp provides the ability to extend Echarts. If the original chart types in DataInsights cannot meet the actual project needs, you only need to write a small number of codes to easily and quickly expand the required charts. If your expanded charts need to support the data selecting, fields inputting, and other settings in the property panel on the right, DataInsghts also provides drop-down selectors, input boxes, and buttons for you to use during the extension process.
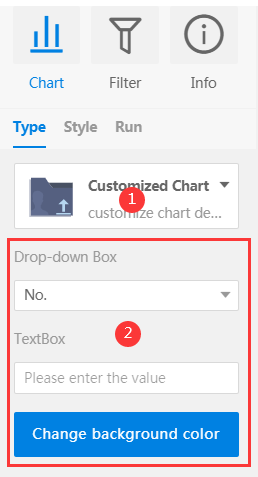
Figure 1 Chart Figure 2 Properties panel
Before the chart extension, please read the Datainsight WebApp extension process. This section only introduces the extension steps of charts.
Step 1: In the js files of created charts, instantiate iDataInsights.Plugins.Chart, the code is as follows:
const chart = {
// Chart Type, English, Uppercase
type: 'CUSTOM',
// Thumbnail, Base64 encoding or Image path
thumbnail: './libs/plugins/images/xxx.png',
// Chart Name
name: 'Customized Chart',
// Chart Description, no more than 10 characters
remark: 'customize chart description content'
}
const chartInstance = new iDataInsights.Plugins.Chart([chart]);
thumbnail, Set the thumbnail of the extended chart displayed in the property panel, corresponding to the picture in the area marked by red 1 in Figure 2.
name, The extended charts' name, corresponding to the upper bold text in the area marked by red 1 in Figure 2.
remark, The description of the expanded chart, corresponding to the text below the area marked by red 1 in Figure 2.
Step 2: Create the configuration items of the chart, and call the bindCreateOption interface to bind the chart configuration items to the chart instance, as shown below. Among them, the configuration items of the created chart must conform to the Echarts configuration items.
nstance.bindCreateOption(createOption);
Step 3: Create the components required for the entry item of chart data (such as the drop-down box, text box, and button in the area identified by red 2 in Figure 2 above), and call the registerComponents interface to register it to the chart instance, the code is as follows. The currently supported components include selectors, input boxes, and buttons. For component interfaces, please refer to component interfaces. ( Optional step)
Note:
1. If the props component needs to use the values in the original chart data, you can pass the initialization parameters (such as:'', [], {}, etc.) when calling registeringComponents interface, and then call the updateComponent method in createOption to update the component.
2. It is recommended to use self-executing functions to wrap the entire js file to avoid the variable conflicts and the global objects pollution.
3. Currently, customized charts do not support functions such as filters, styles, and analysis.
Reference: